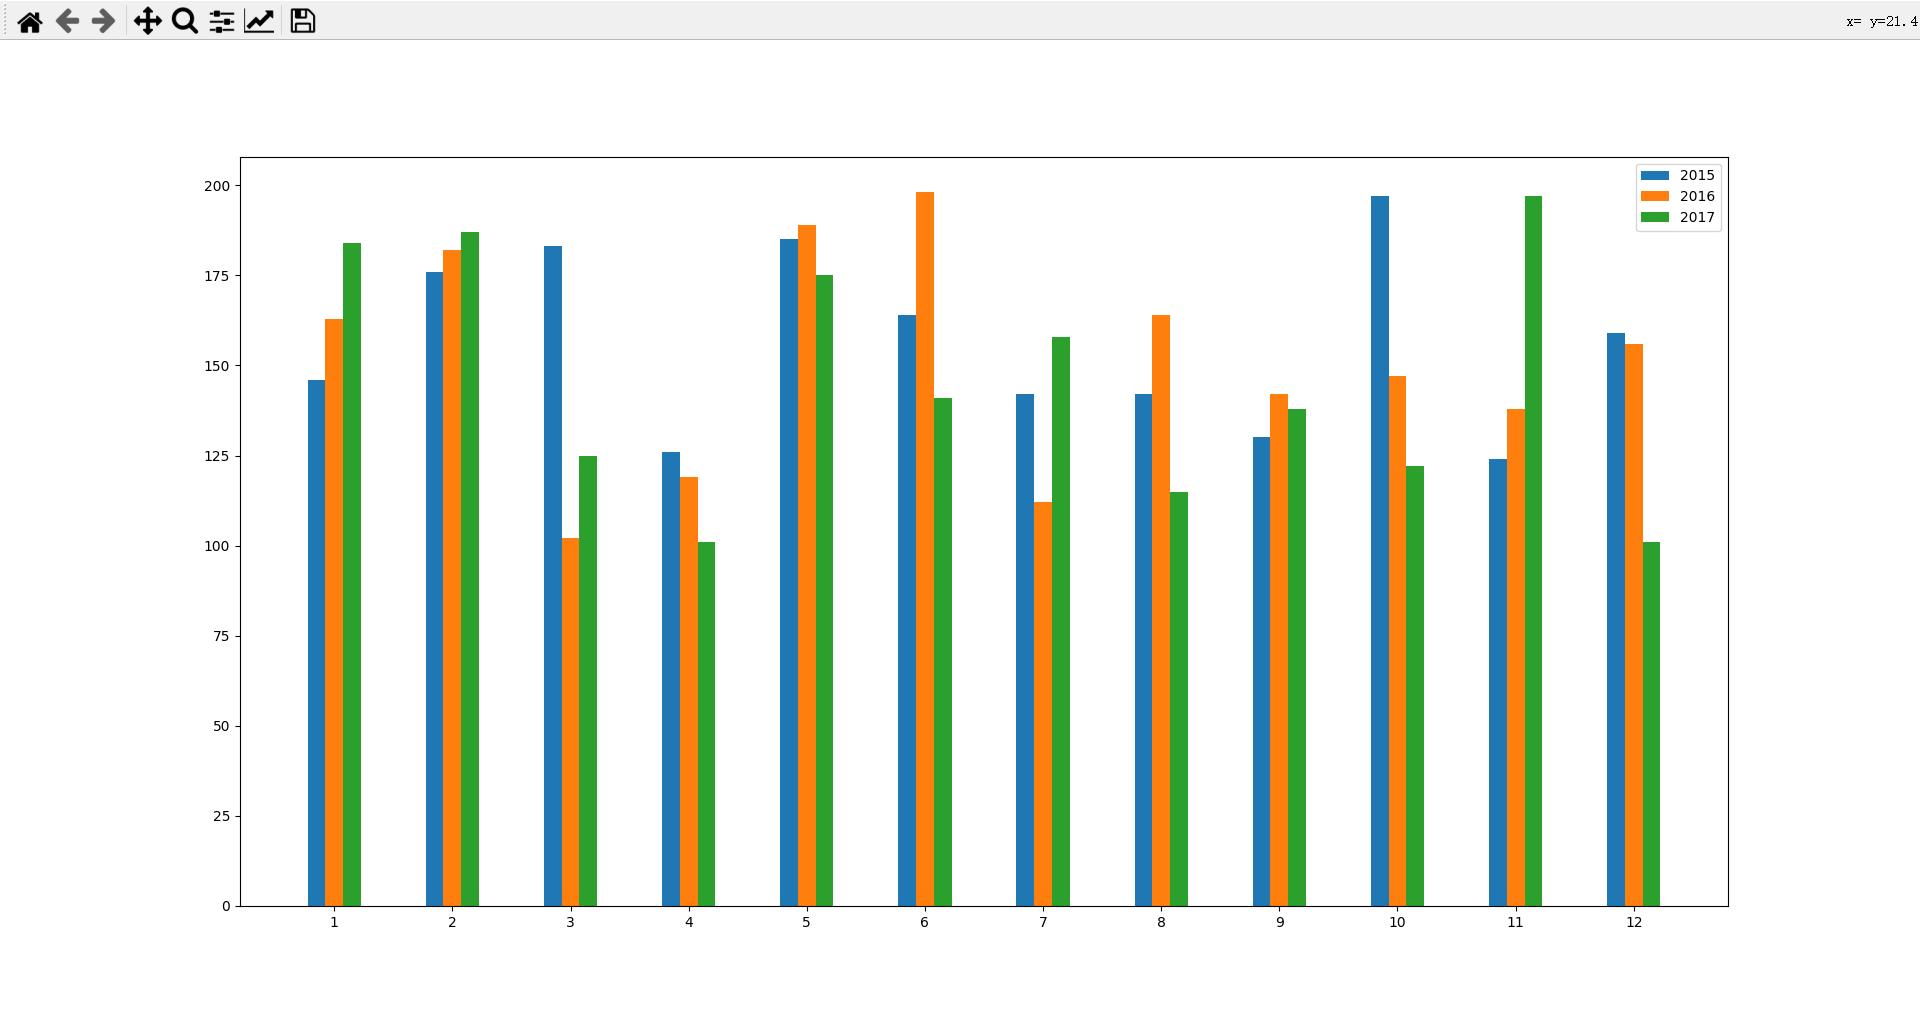
使用for循环绘制Pandas复合索引图
数据很简单,就是按年月分组数据, 绘制出每年,每月的条形图, 年份作为序列, 月份作用X轴
import numpy as np
import pandas as pds
from matplotlib import pyplot as plt
raw_data = pds.read_excel('./data/data.xlsx')
# print(raw_data)
group_data = raw_data.groupby(['year','month']).sum()
# print(group_data) 预览数据print(group_data)# sales# year month# 2015 1 146# 2 176# 3 183# 4 126# 5 185# 6 164# 7 142# 8 142# 9 130# 10 197# 11 124# 12 159# 2016 1 163# 2 182# 3 102# 4 119# 5 189# 6 198# 7 112# 8 164# 9 142# 10 147# 11 138# 12 156# 2017 1 184# 2 187# 3 125# 4 101# 5 175# 6 141# 7 158# 8 115# 9 138# 10 122# 11 197# 12 101
查看group_data 的索引
[[2015, 2016, 2017], [1, 2, 3, 4, 5, 6, 7, 8, 9, 10, 11, 12]]
# 取年份索引
year_list = group_data.index.levels[0].values
# 取月份索引
month_list = group_data.index.levels[1].values
# 设置条形图宽度与偏移量
loca = 0.3
# 将X轴坐标值扩大2倍
large_xticks = month_list*2
# 因为有3个序列,+loca使刻度值在中间的条形图上
plt.xticks(large_xticks+loca,month_list)
# 循环年份索引
for n,year in enumerate(year_list):
# print(year)
# 使用loc取值
data = group_data.loc[year]
# 设置x轴位置与偏移量,loca*n计算在X轴的位置
xloc = large_xticks+loca*n
# print(xloc)
# 为防止条形图序列堆积在一起, 设置width = loca初始值
plt.bar(xloc, data['sales'],width=loca,label=year)
# 为防止条形图序列堆积在一起, loca 的递增值应=loca的初始值
# loca += 0.3
# group_data.plot(kind='bar')
plt.legend()
plt.show()
输出效果